

Manufacturing dashboards give production teams real-time visibility into machine performance, production rates, inventory, quality, and other critical shop floor metrics. By bringing this information into one view, manufacturers can identify bottlenecks faster, respond to production issues, and track improvements over time.
But collecting manufacturing data is only part of the equation. The real value comes from turning shop floor data into information that operators, supervisors, and managers can understand and act on.
Manufacturing Execution Systems (MES) help bridge that gap by collecting production data and presenting it through real-time dashboards, alerts, and historical reporting.
What Is a Manufacturing Dashboard?
A manufacturing dashboard is a visual display of production data that helps teams monitor what is happening across the shop floor.
Depending on the operation, a manufacturing dashboard may track:
- Production status and progress
- Machine performance and downtime
- Work center activity
- Labor and resource utilization
- Inventory and material availability
- Quality issues and alerts
- Overall Equipment Effectiveness (OEE)
- Production bottlenecks
Instead of relying on spreadsheets, paper reports, or information collected after a shift is complete, digital manufacturing dashboards make production information easier to access and understand.
When dashboards are connected to an MES, that information can also update as production activity occurs.
How Digital Dashboards Help Track and Improve Production
Manufacturing dashboards turn shop floor activity into information teams can use to make faster decisions.
When supervisors and operators can see current production conditions, they can identify problems earlier and respond before a small disruption becomes a larger production issue.
For example, a dashboard may reveal that a work center is falling behind schedule, a machine has unexpectedly stopped, material is running low, or a quality issue requires attention.
Instead of discovering the problem hours later, the appropriate team can respond while production is still underway.
This visibility can help manufacturers:
- Identify production bottlenecks
- Reduce unnecessary downtime
- Respond to quality issues faster
- Improve labor and machine utilization
- Monitor progress toward production goals
- Keep materials flowing to the right areas
- Make decisions using current shop floor information
The goal is not simply to display more data. It is to provide the right information to the right people when they can still act on it.
The Power of Real-Time Manufacturing Data
Real-time manufacturing dashboards provide continuous visibility into production operations.
Production teams can monitor machine performance, production rates, inventory levels, work center activity, and other operational metrics as work takes place.
That immediacy is important.
If production begins falling behind, a supervisor can investigate. If materials are becoming unavailable, the team can respond. If a quality alert appears, operators can address the issue before additional parts are affected.
Real-time data also creates greater transparency across the shop floor. Operators, supervisors, and managers can work from the same production information rather than relying on disconnected reports or updates passed between departments.
With greater visibility, teams can proactively manage workflows, reduce interruptions, and make more informed decisions throughout the production day.
Real-Time vs. Historical Manufacturing Data
Real-time and historical manufacturing data serve different purposes, and manufacturers benefit from having access to both.
Real-time data answers: What is happening right now?
It helps teams monitor current production and respond to immediate issues.
Historical data answers: What has been happening over time?
It allows manufacturers to identify recurring patterns, compare performance, investigate root causes, and determine whether process changes are producing results.
For example, a real-time dashboard might alert a supervisor that a work center is behind schedule. Historical data can help determine whether that same work center routinely falls behind, when the problem typically occurs, and what factors may be contributing to it.
Together, real-time and historical data give manufacturers both immediate visibility and the context needed for continuous improvement.
How Historical Data Supports Continuous Improvement
As manufacturing data accumulates, it becomes a valuable resource for identifying patterns and improving operations.
Historical production data helps manufacturers set performance benchmarks and compare current results with previous periods. This makes it easier to determine whether operational changes are actually improving production.
Historical information is also valuable for root cause analysis.
Instead of repeatedly addressing symptoms, teams can review past performance and identify underlying factors that may contribute to downtime, quality issues, bottlenecks, or other recurring challenges.
These insights can support better production planning, resource allocation, preventative action, and long-term process improvement.
Examples of Manufacturing Dashboards in MV2 MES
MV2 MES provides multiple dashboards and visual tools designed to turn shop floor data into actionable information.

Andon Boards
Andon boards originated in lean manufacturing as a way to communicate production status and signal problems on the shop floor. Digital Andon boards expand that concept by providing real-time production updates across the manufacturing environment.
MV2 Andon Boards can help teams quickly identify production conditions that require attention, including machine stoppages, material shortages, and quality alerts.
Giving operators and supervisors greater visibility into these conditions helps teams respond quickly and keep production moving.
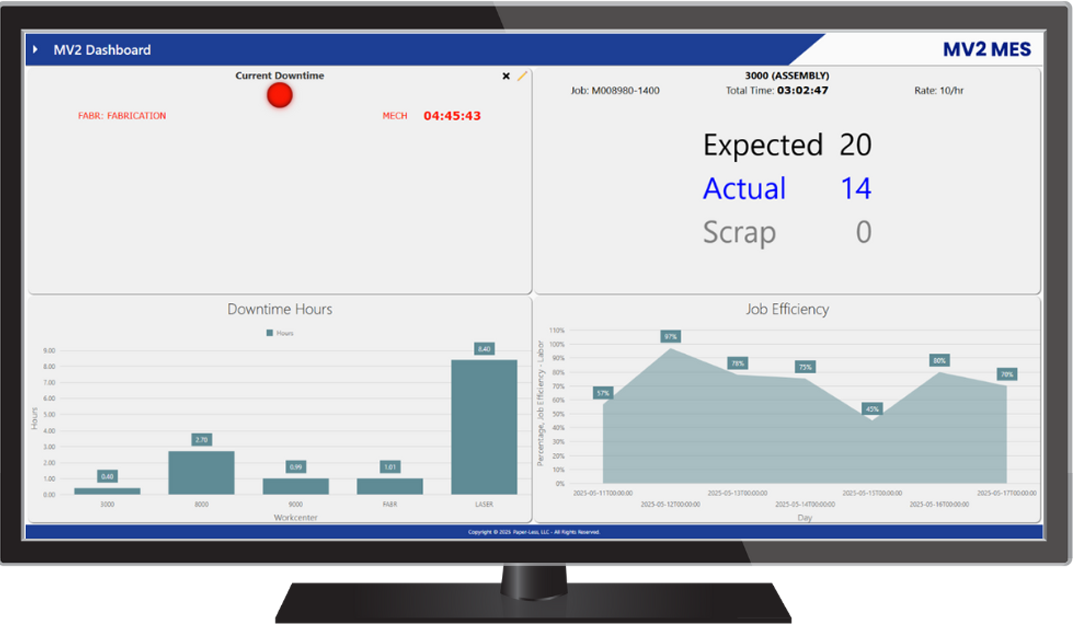
Activity by Work Center Dashboard
The Activity by Work Center Dashboard provides visibility into production activity, performance, and resource utilization at individual work centers.
Managers and supervisors can use this information to identify potential bottlenecks, monitor productivity, and recognize underutilized resources.
This work center-level visibility helps manufacturers better understand how labor and equipment are being used throughout production.

Kanban Status and Alerts
Material availability can have a direct impact on production performance.
MV2 Kanban Status and Alerts provide visibility into inventory levels and material flow so teams can identify when resources need attention.
Real-time Kanban alerts can help manufacturers reduce the risk of stockouts and keep materials moving to the areas where they are needed..
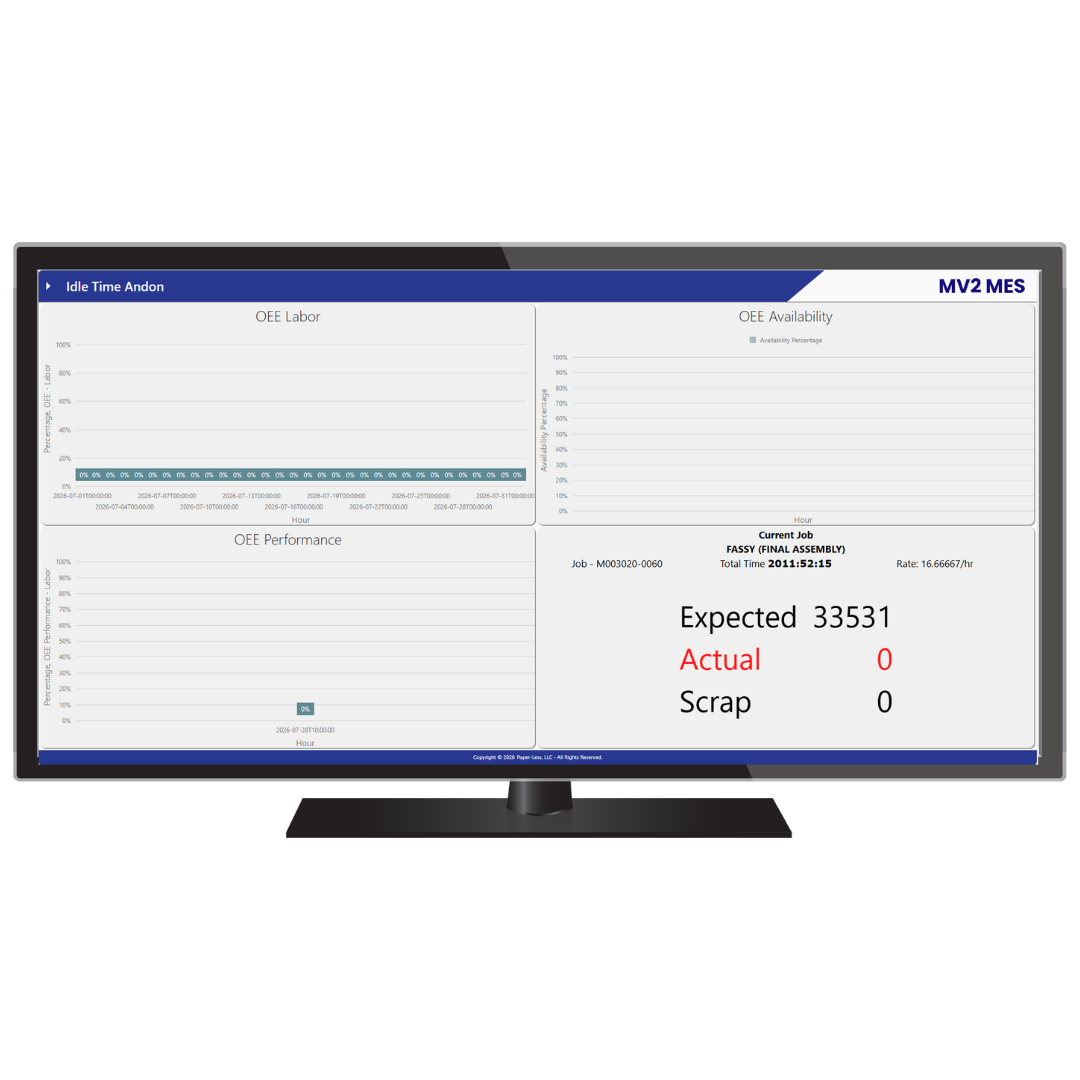
OEE Dashboards
Overall Equipment Effectiveness (OEE) measures manufacturing productivity using three primary factors: availability, performance, and quality.
MV2 OEE Dashboards bring these metrics together to help manufacturers understand how effectively equipment and production resources are operating.
Tracking OEE over time can help teams identify inefficiencies, uncover bottlenecks, measure improvements, and determine where additional attention may be needed.
What Manufacturing KPIs Should a Dashboard Track?
The most useful manufacturing dashboard depends on the operation and the decisions a team needs to make.
Common manufacturing KPIs and metrics include:
- Production quantity
- Production rate
- Cycle time
- Machine uptime and downtime
- Work center status
- Scrap and quality rates
- Overall Equipment Effectiveness (OEE)
- Schedule attainment
- Labor utilization
- Inventory and material status
A useful dashboard should prioritize actionable information rather than simply displaying every available metric.
The best question is not, “How much data can we put on the screen?”
It is, “What information does this person need to make a better decision?”
Turning Shop Floor Data Into Action with MV2 MES
Manufacturers generate enormous amounts of production data, but data alone does not improve operations.
Teams need a way to collect, organize, visualize, and act on that information.
MV2 MES connects shop floor activity with real-time dashboards, alerts, and historical manufacturing data to give operators, supervisors, and decision-makers greater visibility into production.
By combining immediate production insights with historical analysis, manufacturers can respond to today’s issues while identifying opportunities to improve tomorrow’s performance.
The result is not simply better reporting. It is a clearer understanding of what is happening on the shop floor and what needs attention next.
Request a demo to see how MV2 MES can provide greater visibility into your manufacturing operations.
Frequently Asked Questions About Manufacturing Dashboards
A manufacturing dashboard is a visual display of production information that helps operators, supervisors, and managers monitor shop floor performance. Dashboards can display production status, machine performance, downtime, quality, inventory, OEE, and other manufacturing metrics.
Digital manufacturing dashboards help teams identify production problems and respond faster by making important shop floor information easier to see. They can reveal bottlenecks, downtime, material shortages, quality issues, and other conditions that may affect production performance.
A manufacturing production dashboard should show the information needed to support a specific role or decision. Common metrics include production quantities, production rates, work center status, downtime, quality, OEE, labor utilization, and inventory status.
Real-time manufacturing data shows what is happening on the shop floor now, while historical data shows performance over time. Real-time information supports immediate action, while historical information helps manufacturers identify trends, investigate root causes, establish benchmarks, and measure improvement.
Yes. A Manufacturing Execution System can collect production information from shop floor activities and make that information available through dashboards, alerts, and other visual tools. The exact information available depends on the MES and how it is integrated with the manufacturing environment.
Manufacturing dashboards make production information easier to understand and act on. Instead of waiting for reports or manually gathering data, teams can use dashboards to monitor operations, identify problems, and make more informed production decisions.